
Latest Releases
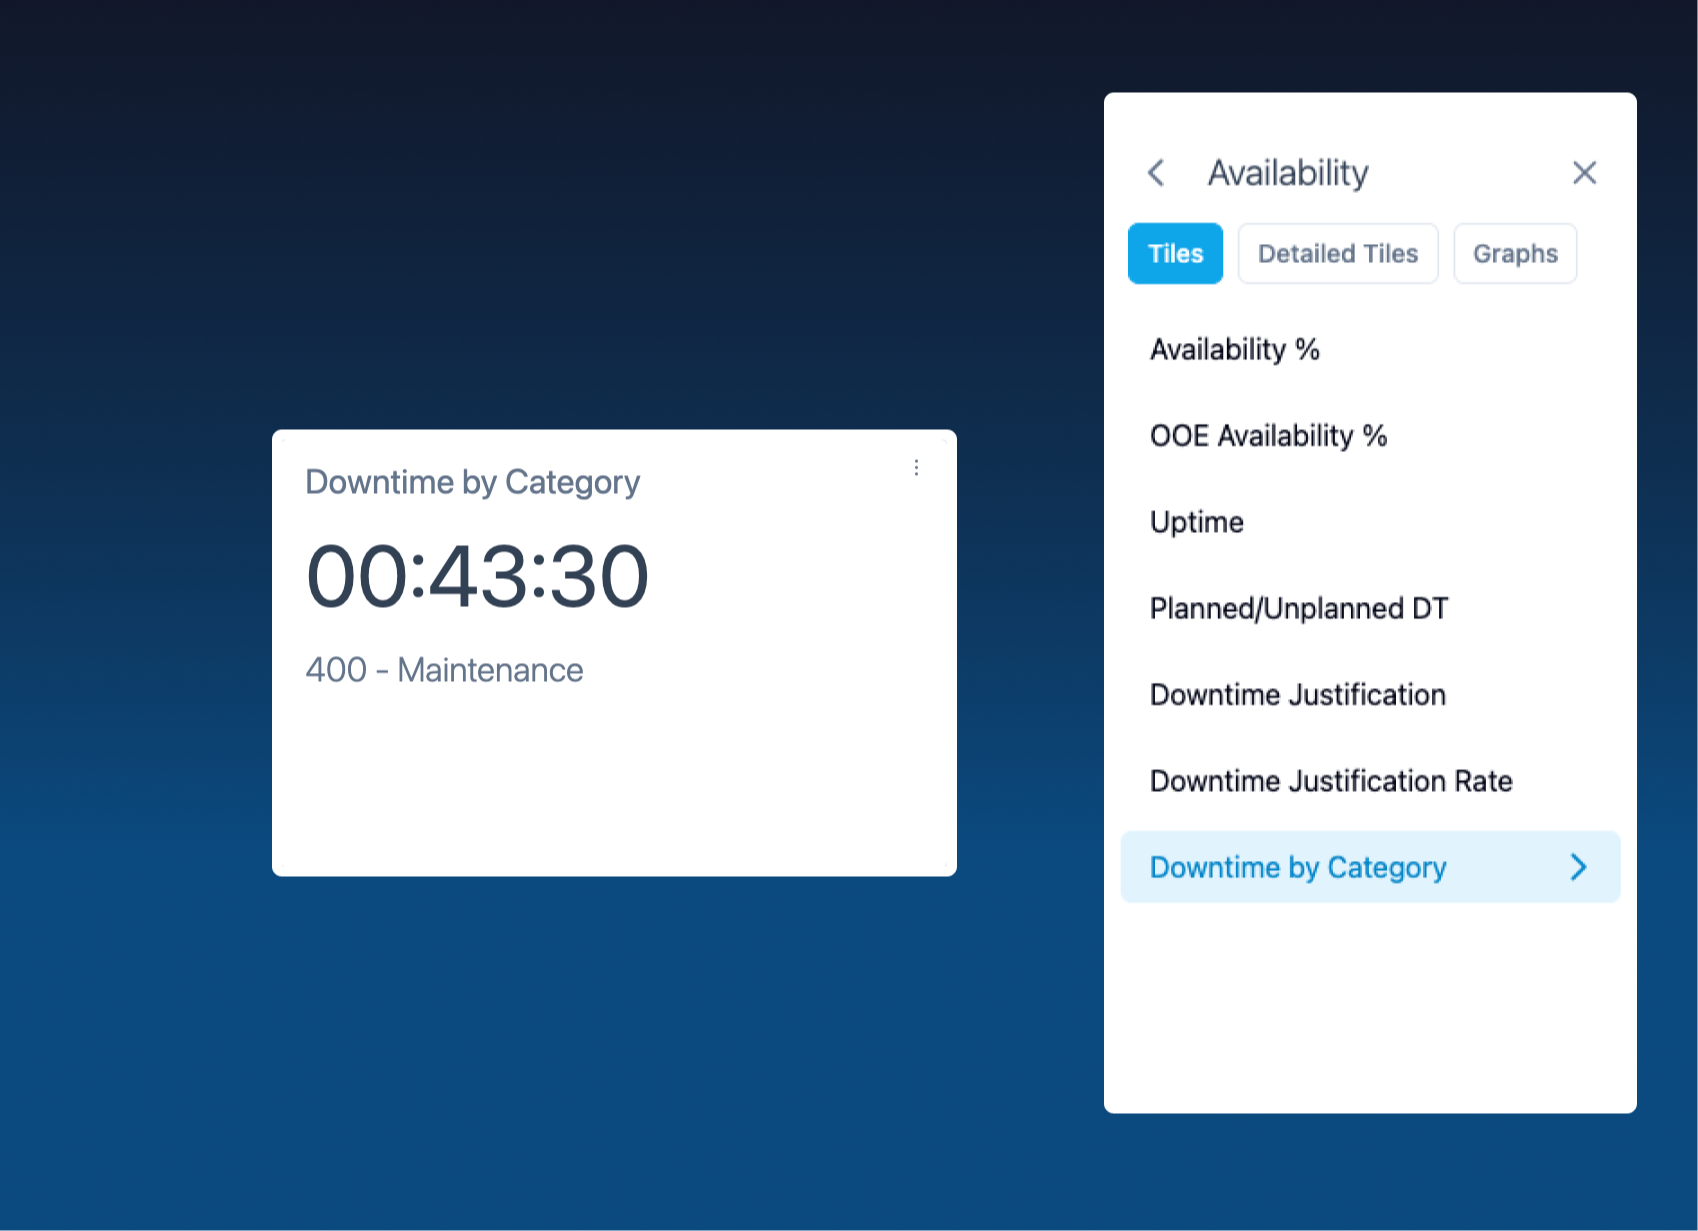
Downtime per Category
You can now track downtime by category directly from the dashboard. Once selected, the tile displays a live counter that accumulates every minute that category is down.
How to set it up: just tap the 3 dots menu on any tile, then choose a category from the KPIs list.
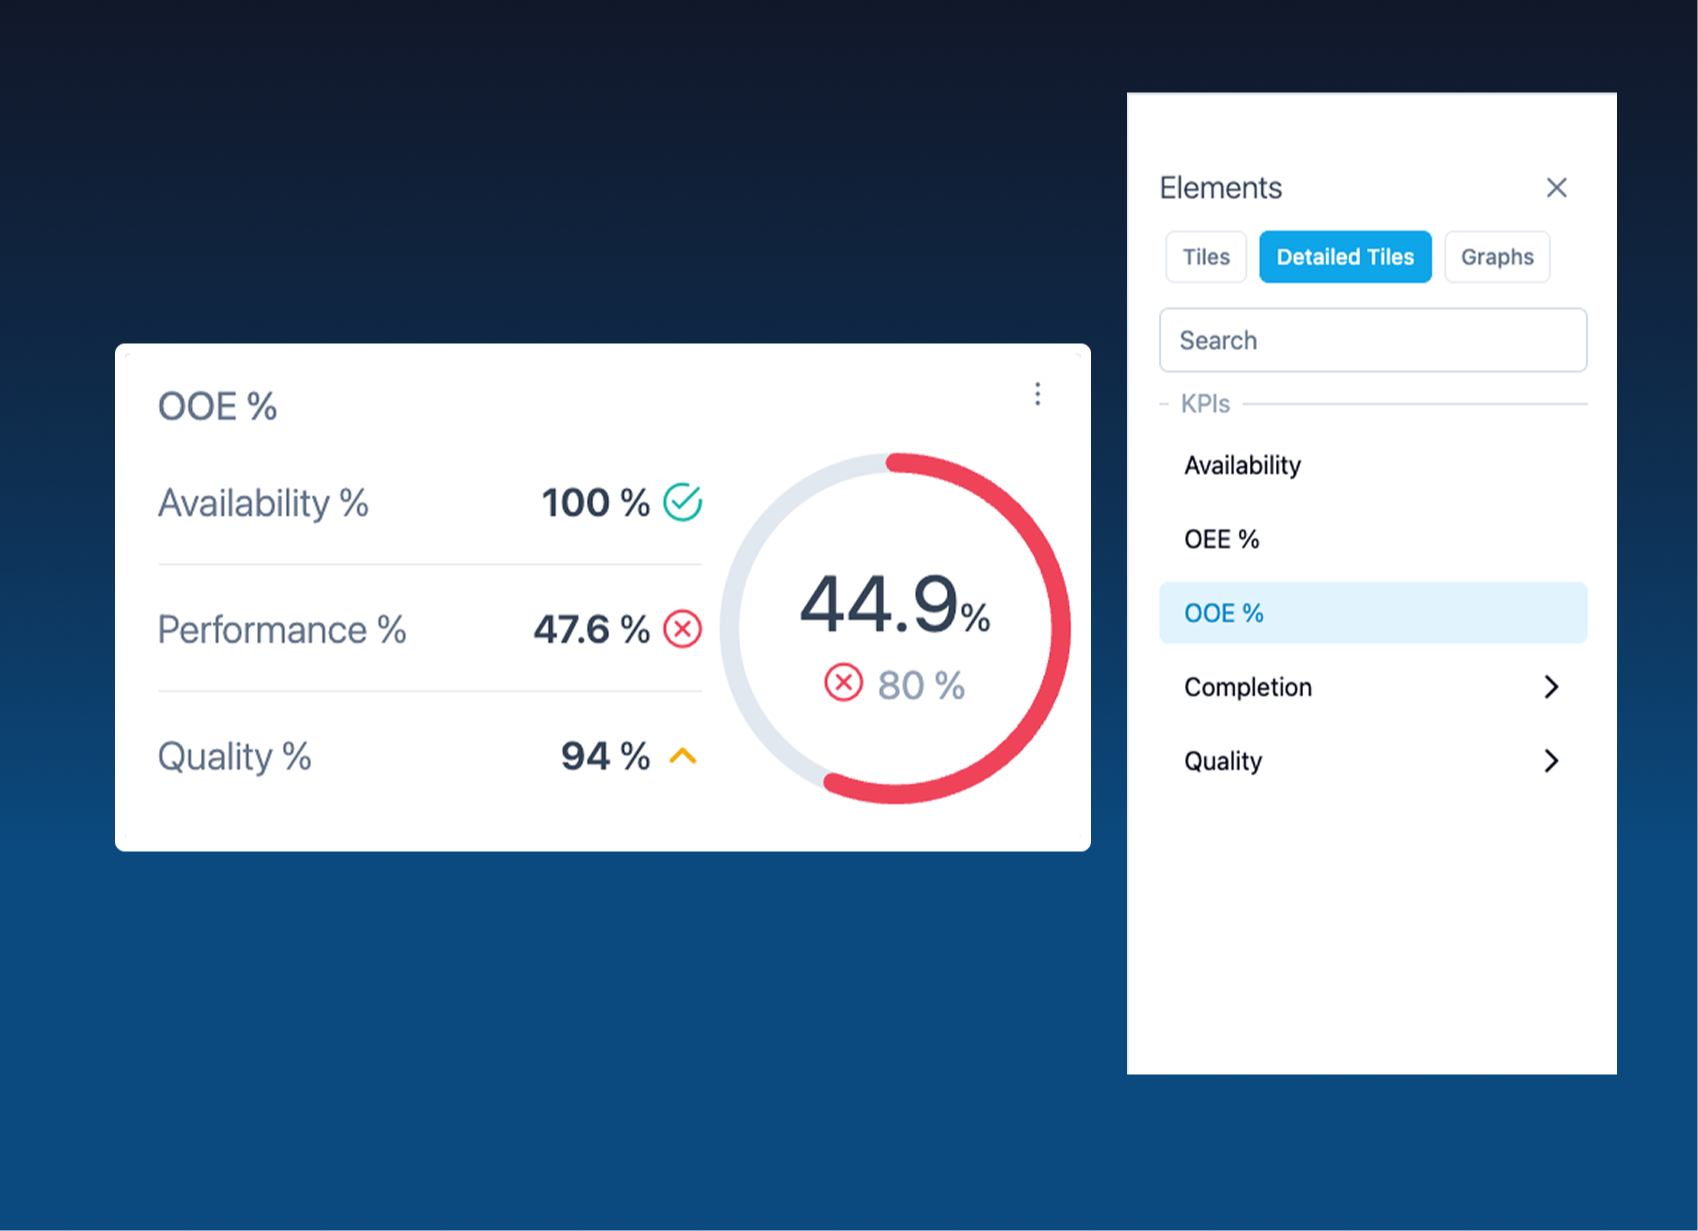
OOE Detailed Tile
You can now add the OOE Detailed KPI tile from the Detailed Tiles menu to get a deeper view of your Overall Operations Effectiveness.
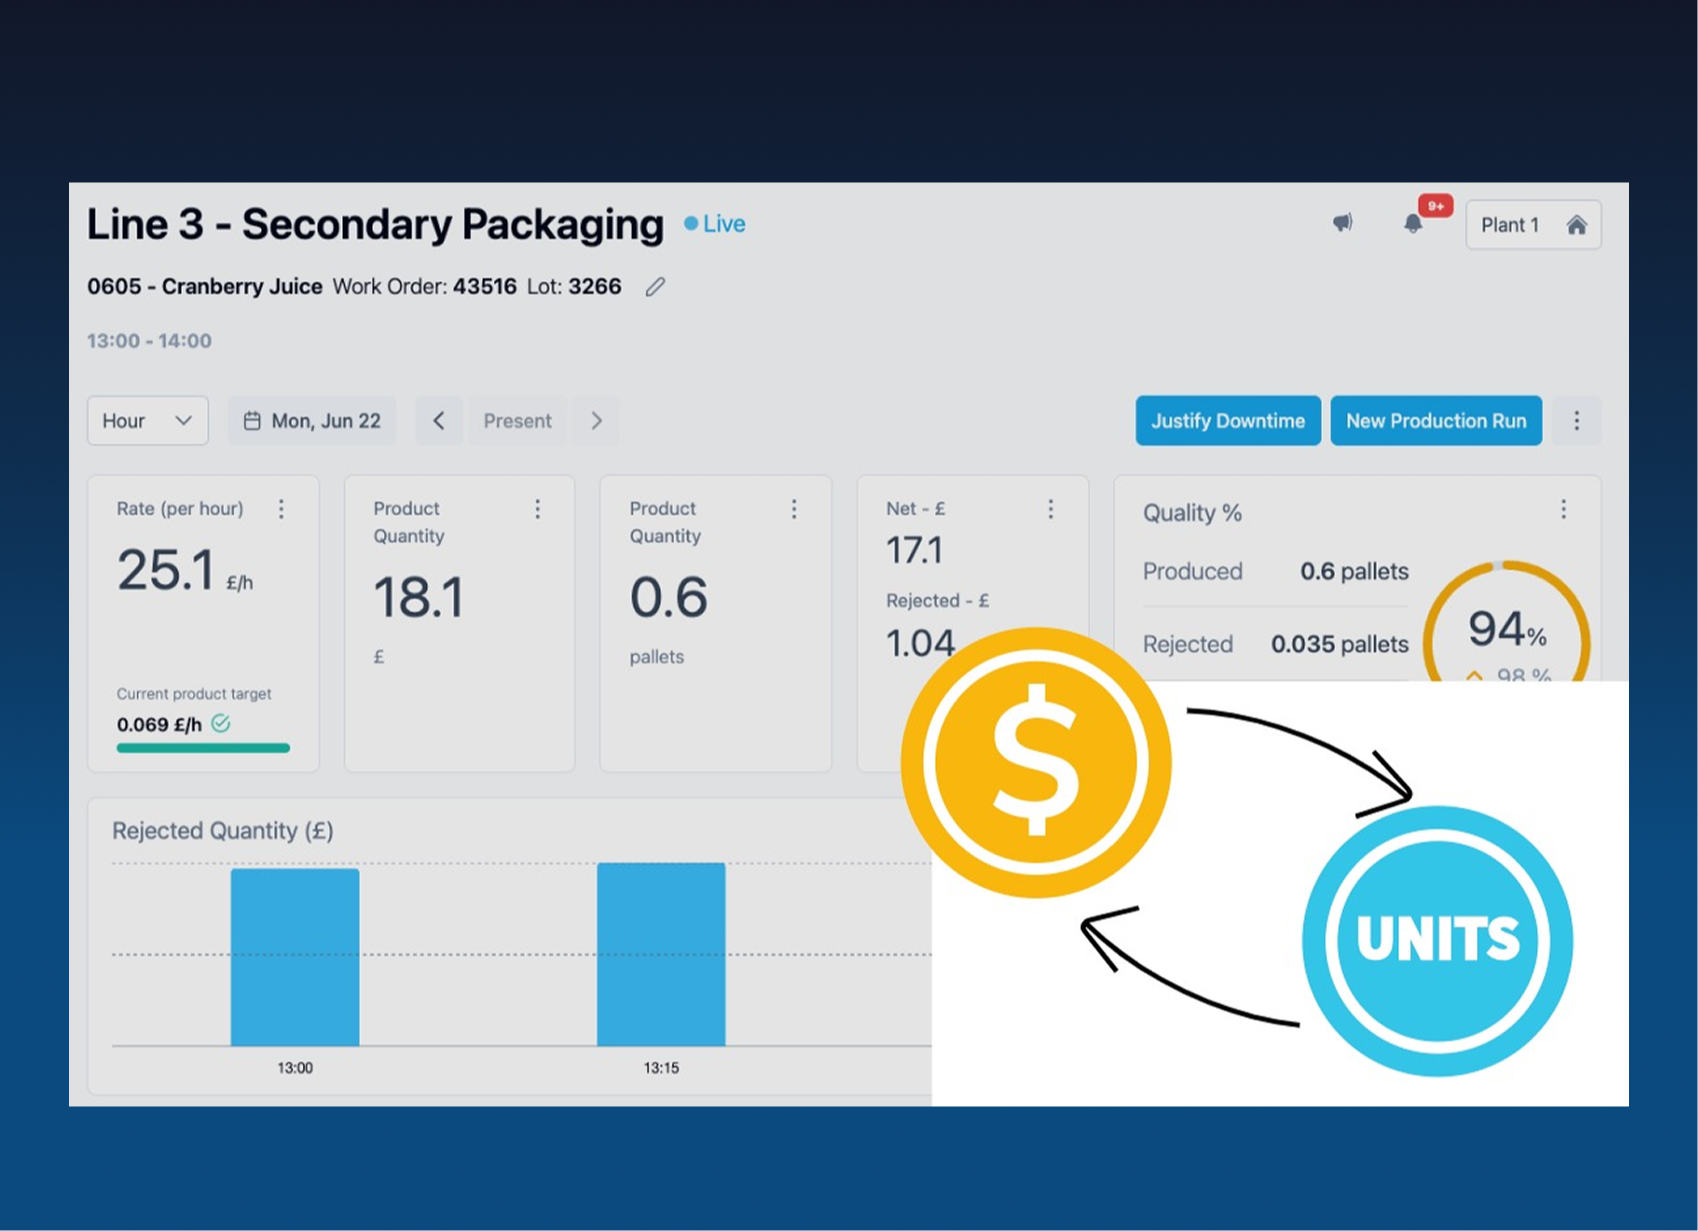
Production in currency values
Translate your output into financial impact — directly on your tiles.
Currency is now a selectable unit, it works just like rate, speed, or quantity.
- Set a unit base price per SKU in the product's Units of Conversion page.
- Values propagate across tiles, overview, and Excel exports automatically.
- Visible for Management Roles Only
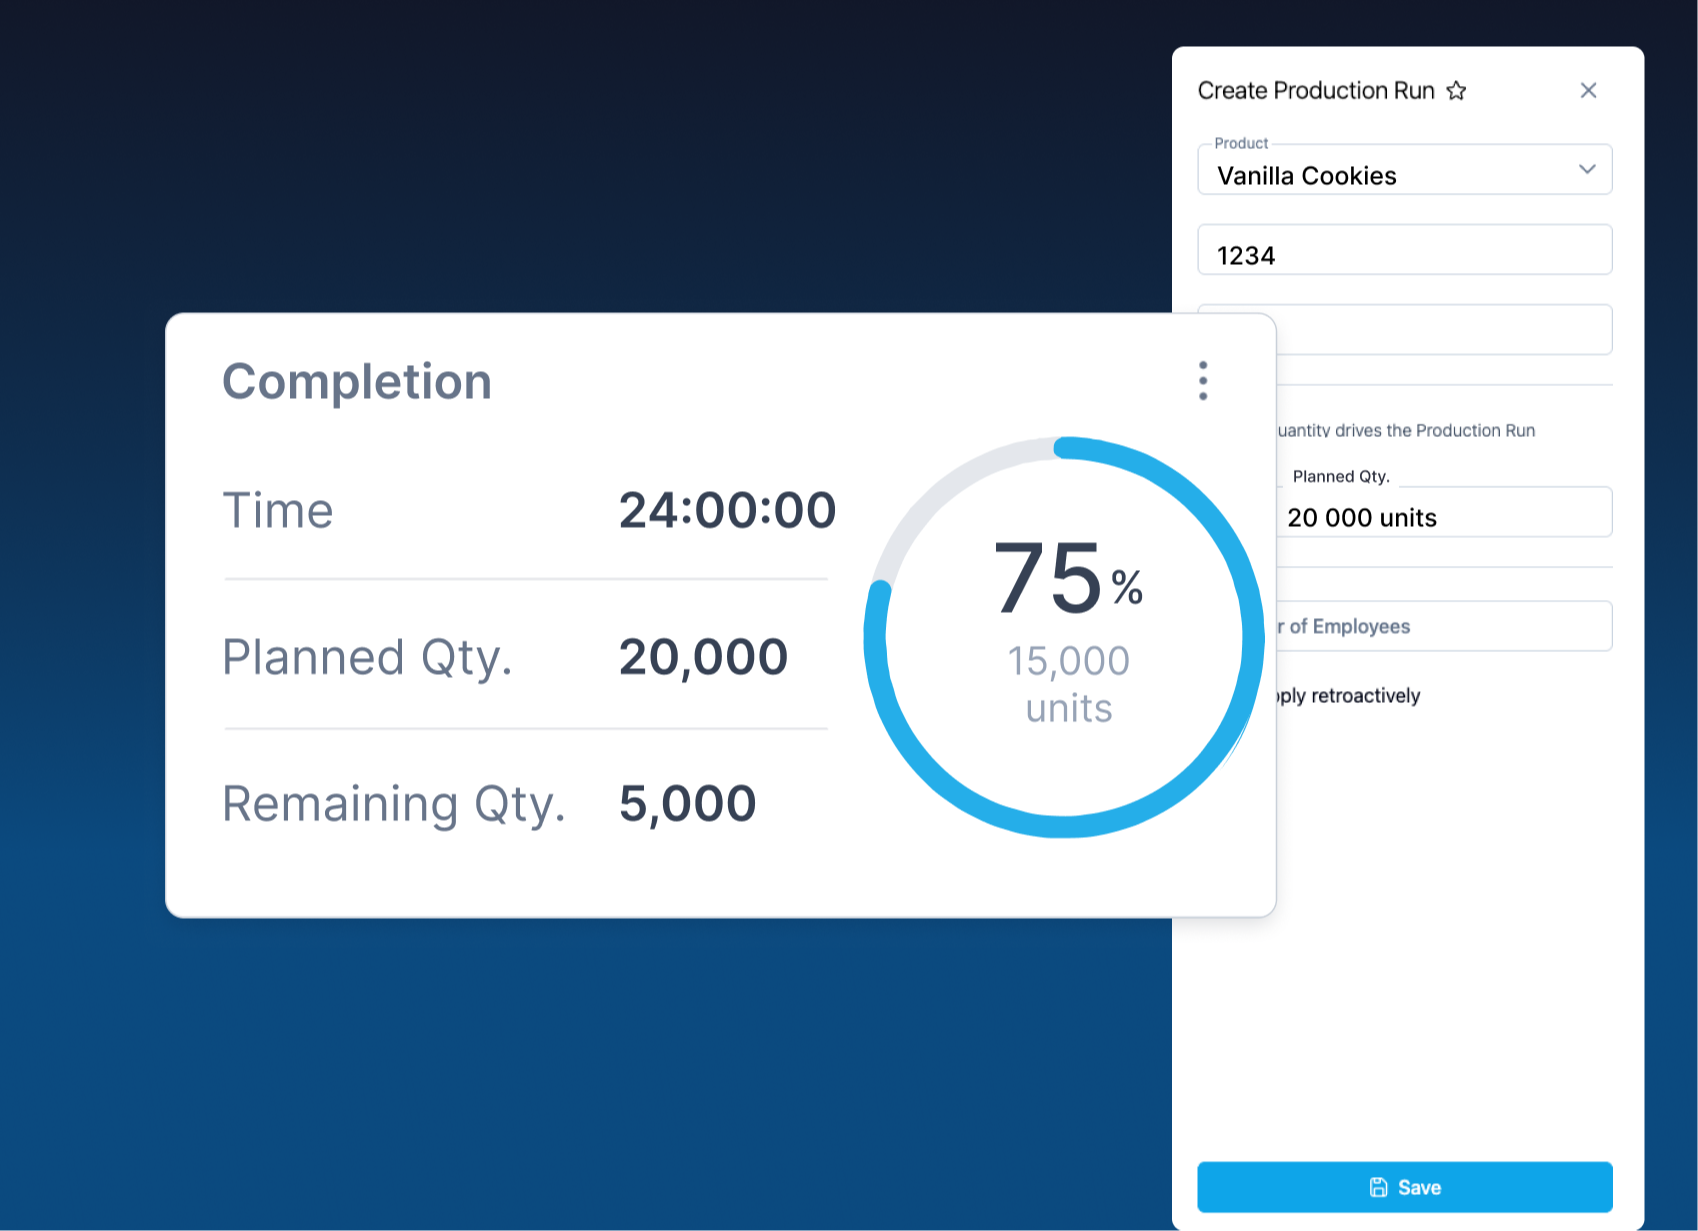
Completion Tile
Track your production progress in real time — view percentage complete, quantity produced, and remaining output at a glance.
Getting started:
- Create a New Production Run and enter the Planned Quantity.
- Select the tile from the Detailed Tiles Menu.
The tile automatically calculates the estimated time to completion based on your current production speed. Any downtime will be reflected in the projection, giving you an up-to-date estimate of when your run will finish.
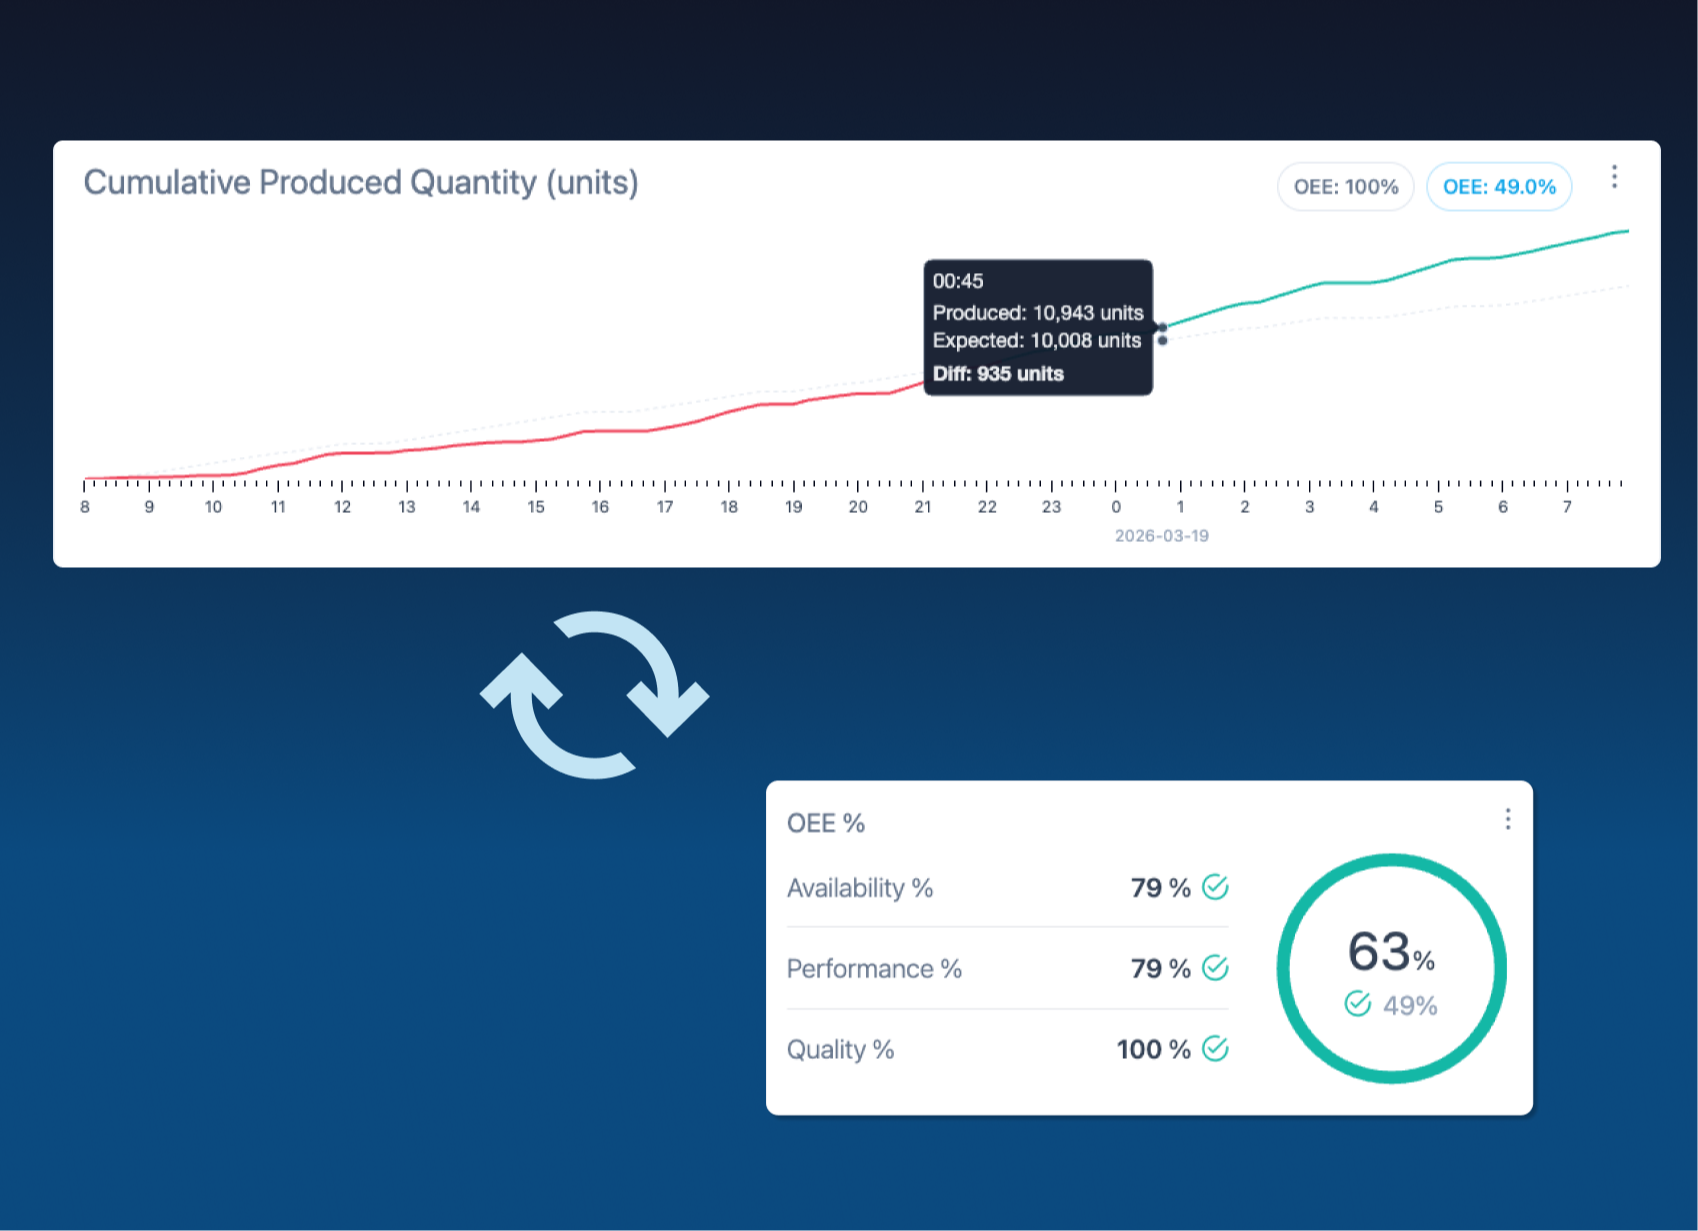
Cumulative quantity graph
Tracks the running total of units produced each hour and overlays it against the expected output derived from your planned quantity and OEE targets — giving your team a clear, hour-by-hour picture of shift performance.
When the line is green means your team runs above or according to the expected target.
A line below in red signals a gap that needs attention before the shift ends.
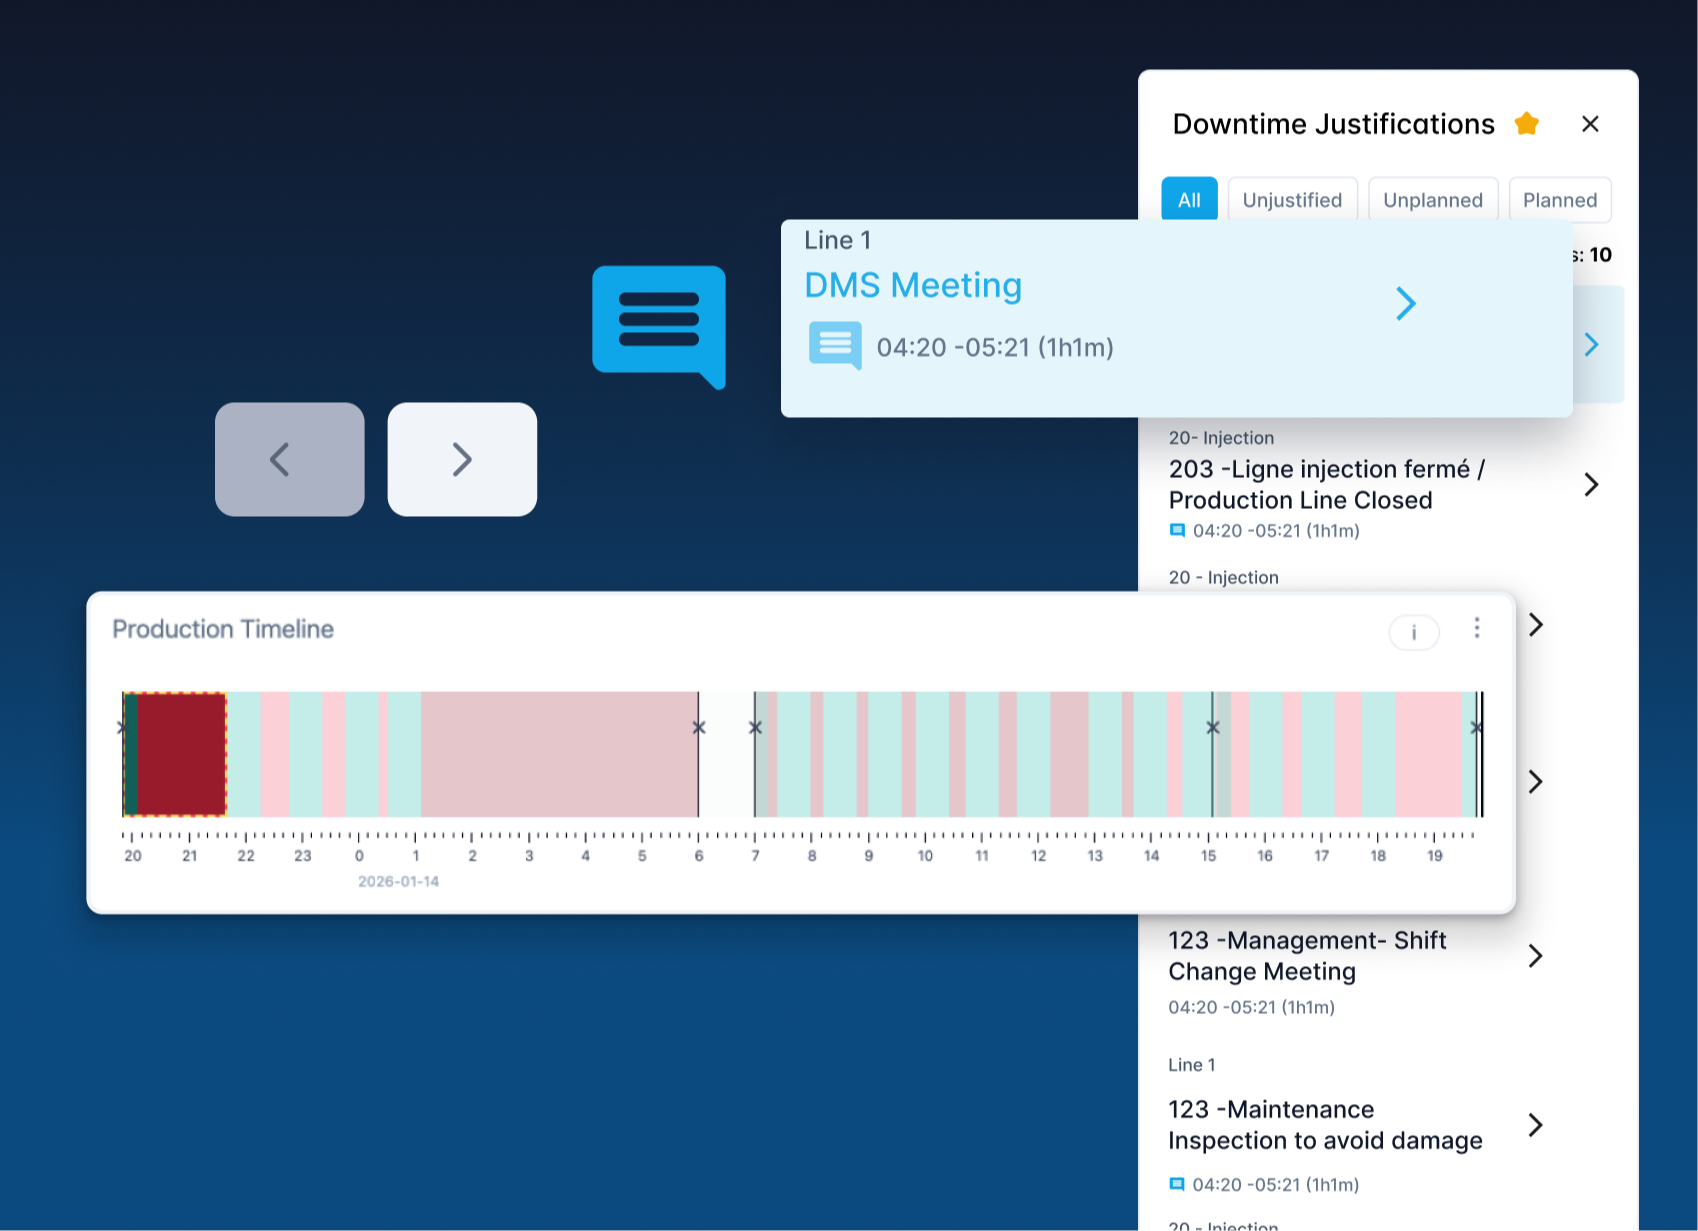
Downtime Improvements
We've simplified cause selection — fewer clicks, a flat list that's easier to scroll, and inline comment flags for causes that need more detail. Use the navigation arrows to move through justifications while keeping full context.
What's coming
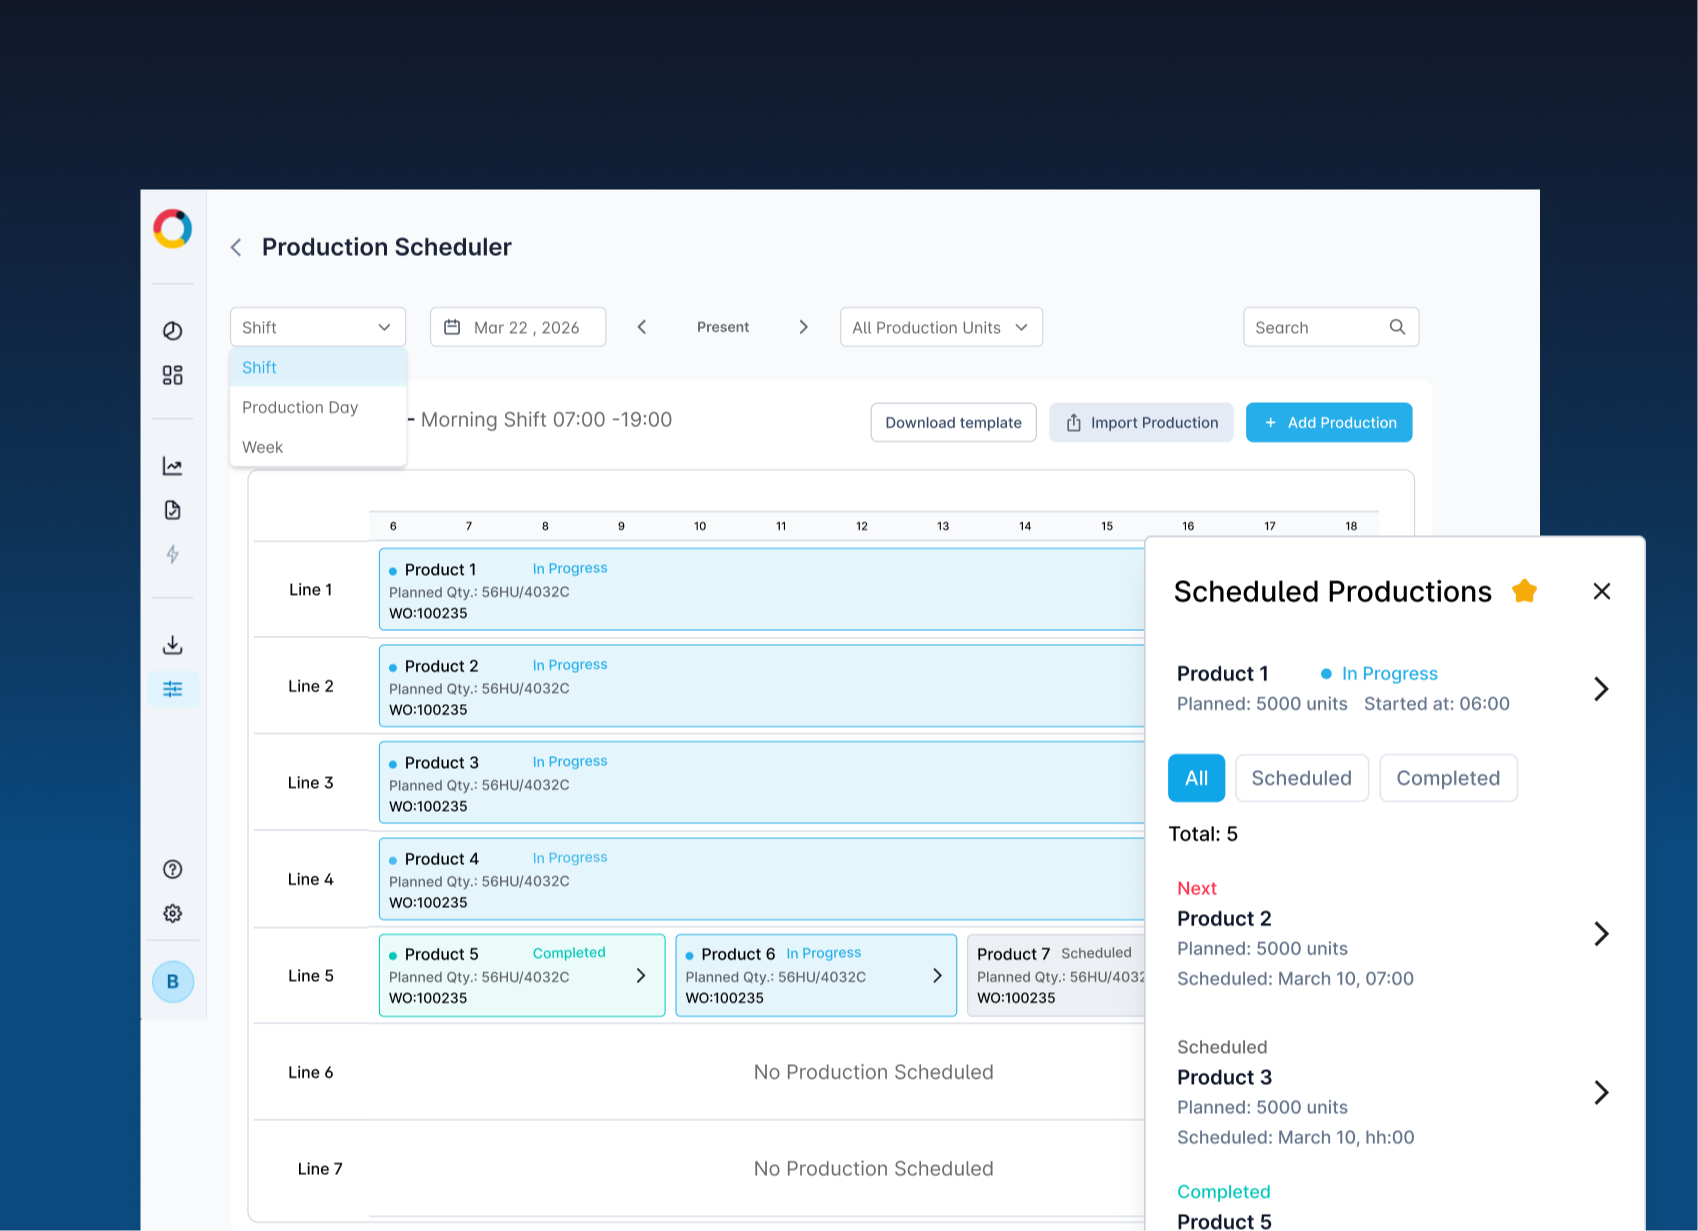
Worximity Scheduler
An interactive, visual planning tool embedded directly in the Worximity environment. It enables planners, supervisors, and operators to work from a single, shared source of truth with full visibility and control.
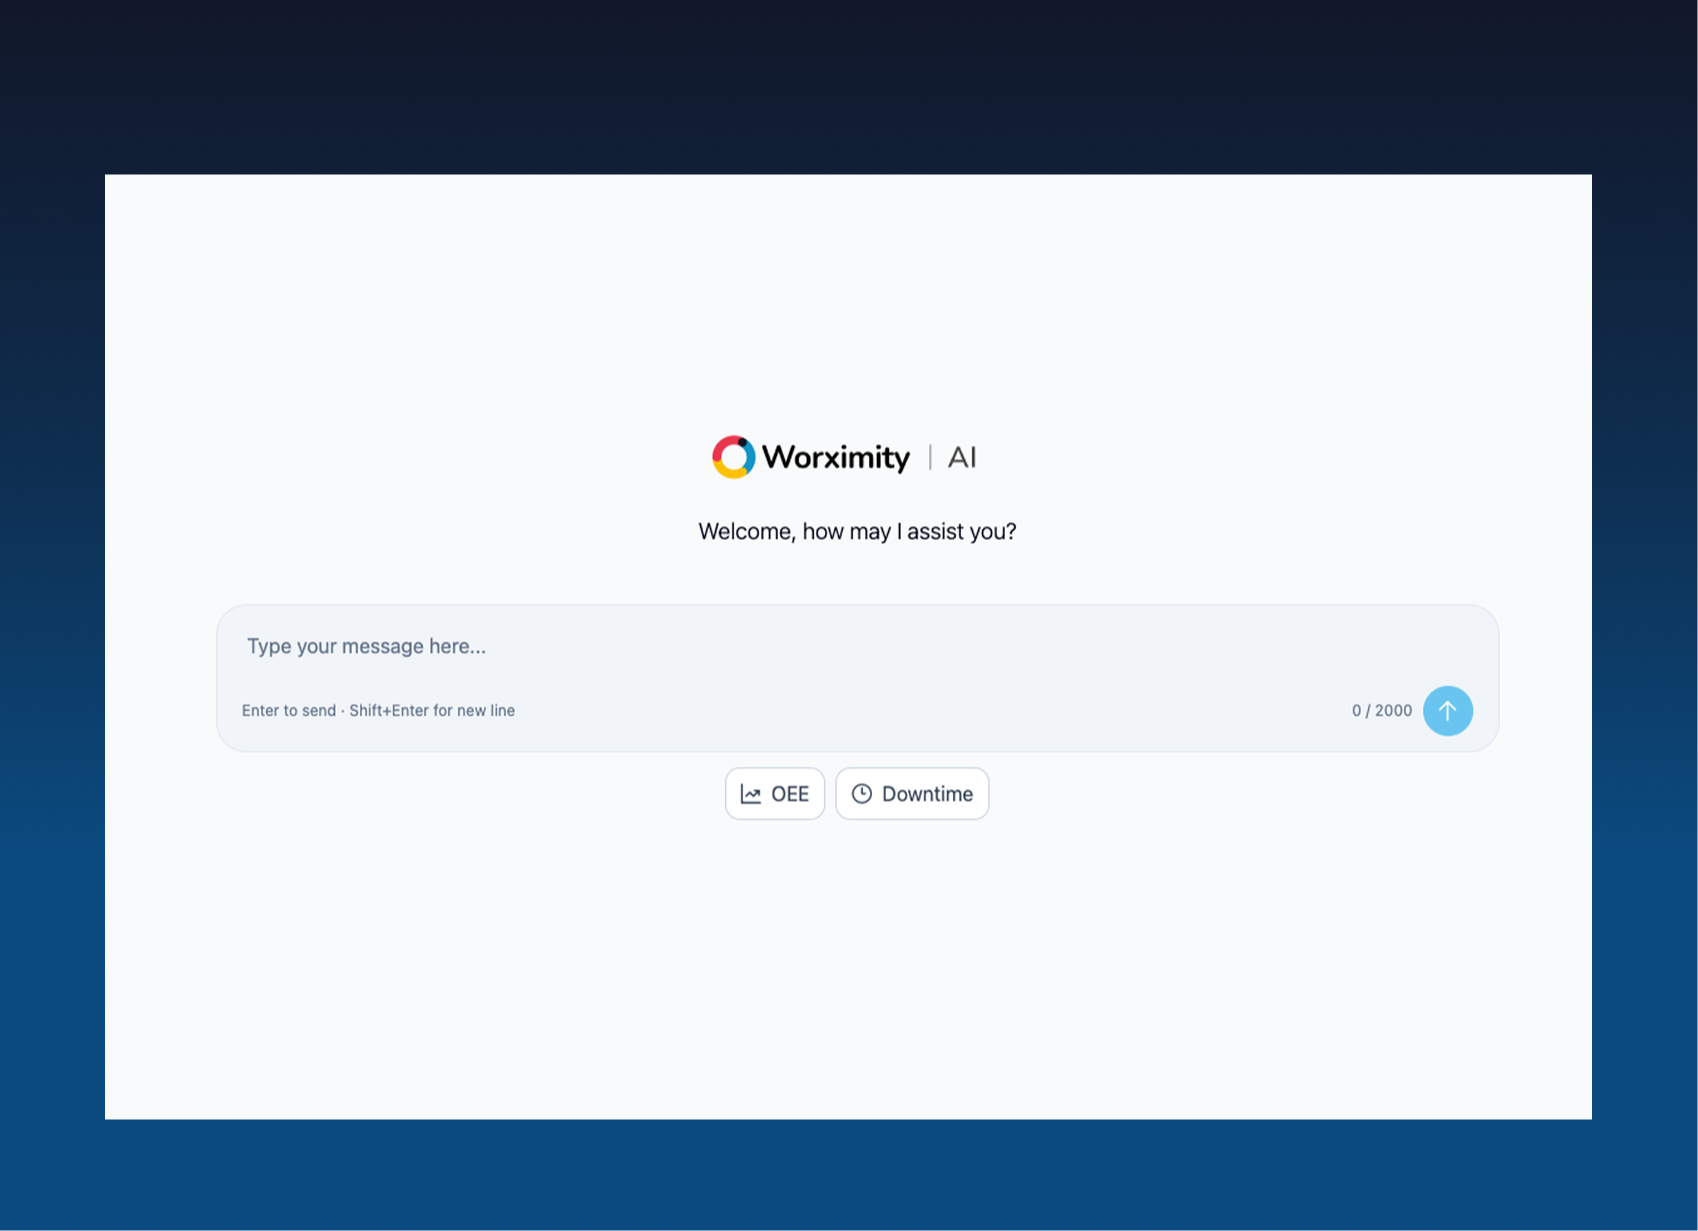
Worximity -AI
Meet your new CI assistant. A new tool dedicated to helping you uncover hidden improvement opportunities and answer your production questions - right when you need it.
