
Welcome to the New Worximity Interface. More customizable, flexible, and equipped with new tools to accelerate your continuous improvement.
With AI, Action Planning, Alerts, Forms, and our already familiar BIs and Tilelytics analysis tools, Worximity becomes your one-stop shop for transforming your data into action, faster than ever. Discover what's new!
Overview
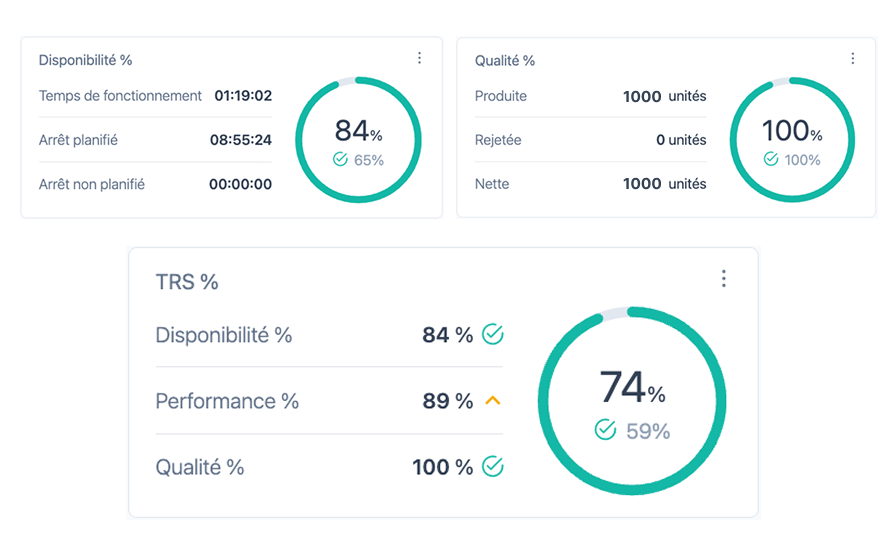
Adjustable tiles: Resize and reposition to focus on the KPIs that matter most. Set specific KPIs for each tile.
Dynamic circle charts: Instantly visualize progress toward target performance.
Live downtime timer: See downtime events unfold in real time.
Clear status indicators: View current downtime codes and statuses per tile.
Saveable views: Tailor views by line or equipment and save them for easy access.
Upgraded Dashboard
Fully customizable layout
- Add unlimited tiles
- Resize and combine different graph types
- Add favorite action buttons: justify downtime, add production run, log rejects, override conversion factor.
New Detailed tiles:
Break down your key KPIs at a glance:
OEE: availability, performance, quality
Quality: quantities produced, rejects, net (Quality module)
Availability: uptime vs. planned and unplanned downtime
Visualize your actual results against targets using progress lines.
New justification panel
- Review all your downtime in one place.
- Easily filter by planned, unplanned and unjustified events.
- Quickly see total downtime duration and number of occurrences.
And this is just the beginning, new features are also there:
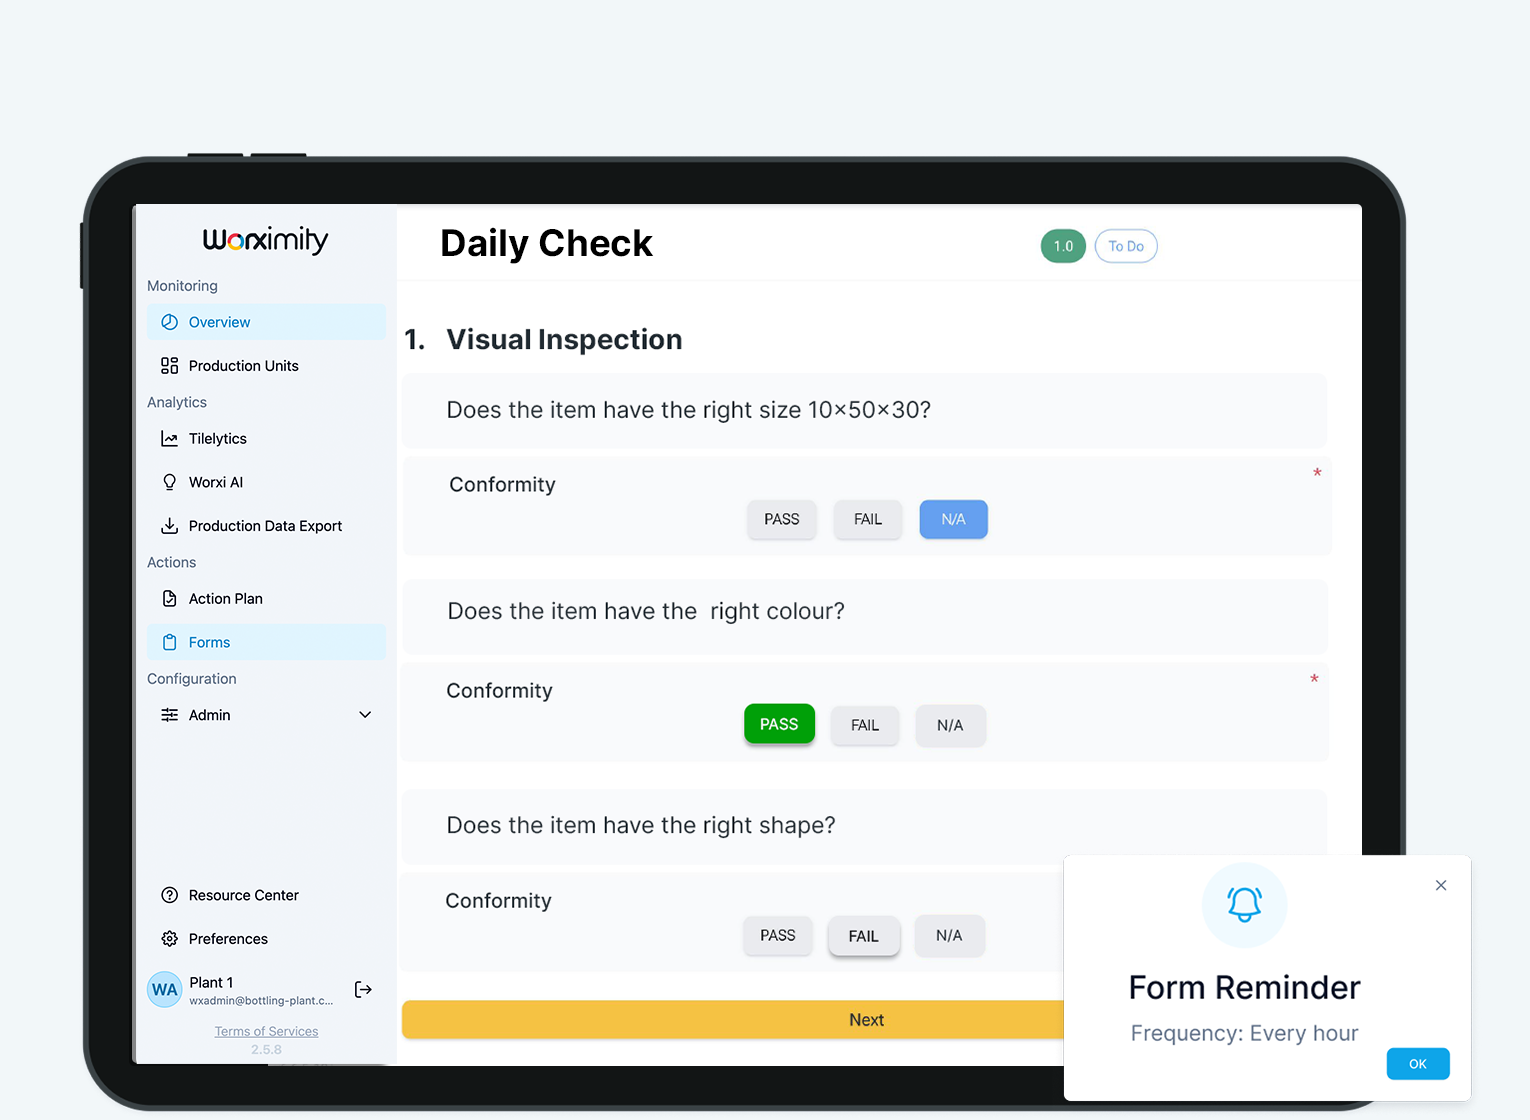
📋 Forms
Simplify, Digitize, Centralize Workflows.
Worximity Forms is an easy-to-use online form builder that centralizes all your production information into one safe, accessible location.
✔ Create checklist
✔ Add photos
✔ Capture Signatures
✔ Pass or Fail Processes
Move from paper to digital
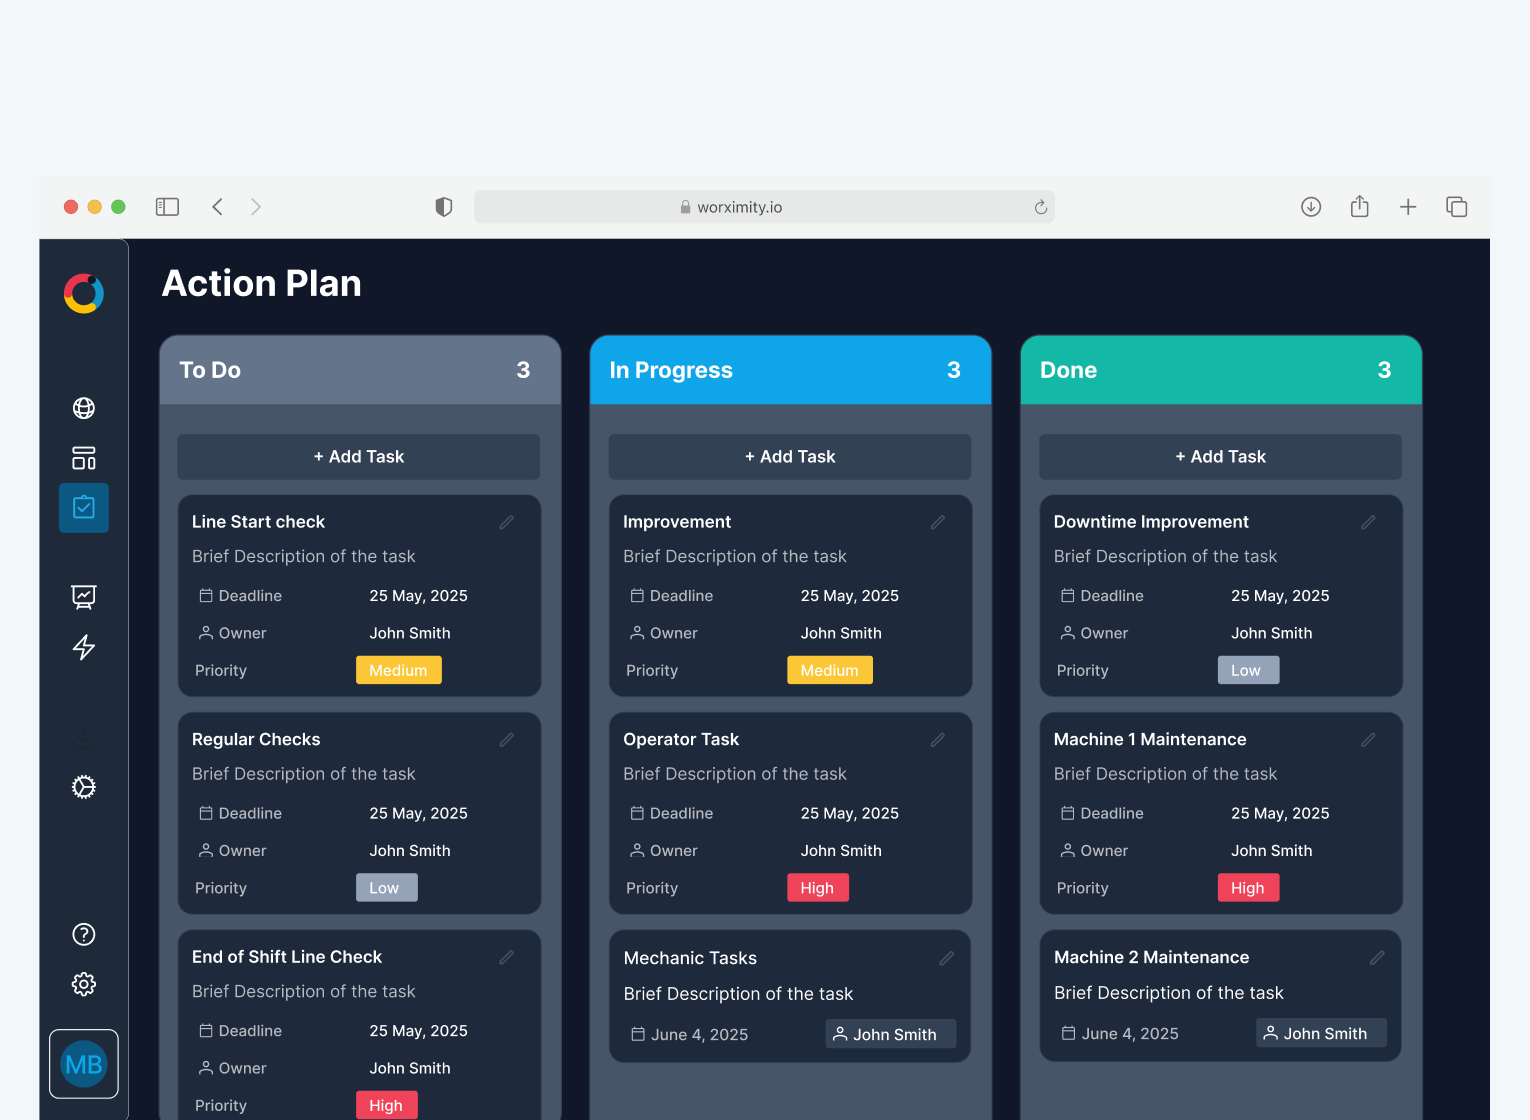
✅ Action Plan
Turn insights into action.
Tile+ now gives you a built-in Kanban board to manage corrective, preventive, and continuous improvement tasks across your plant.
✔ Connect tasks directly to production issues
✔ Prioritize, assign owners, and set deadlines
✔ Track progress with task status and activity
A practical tool for your whole team - from operators to plant managers.
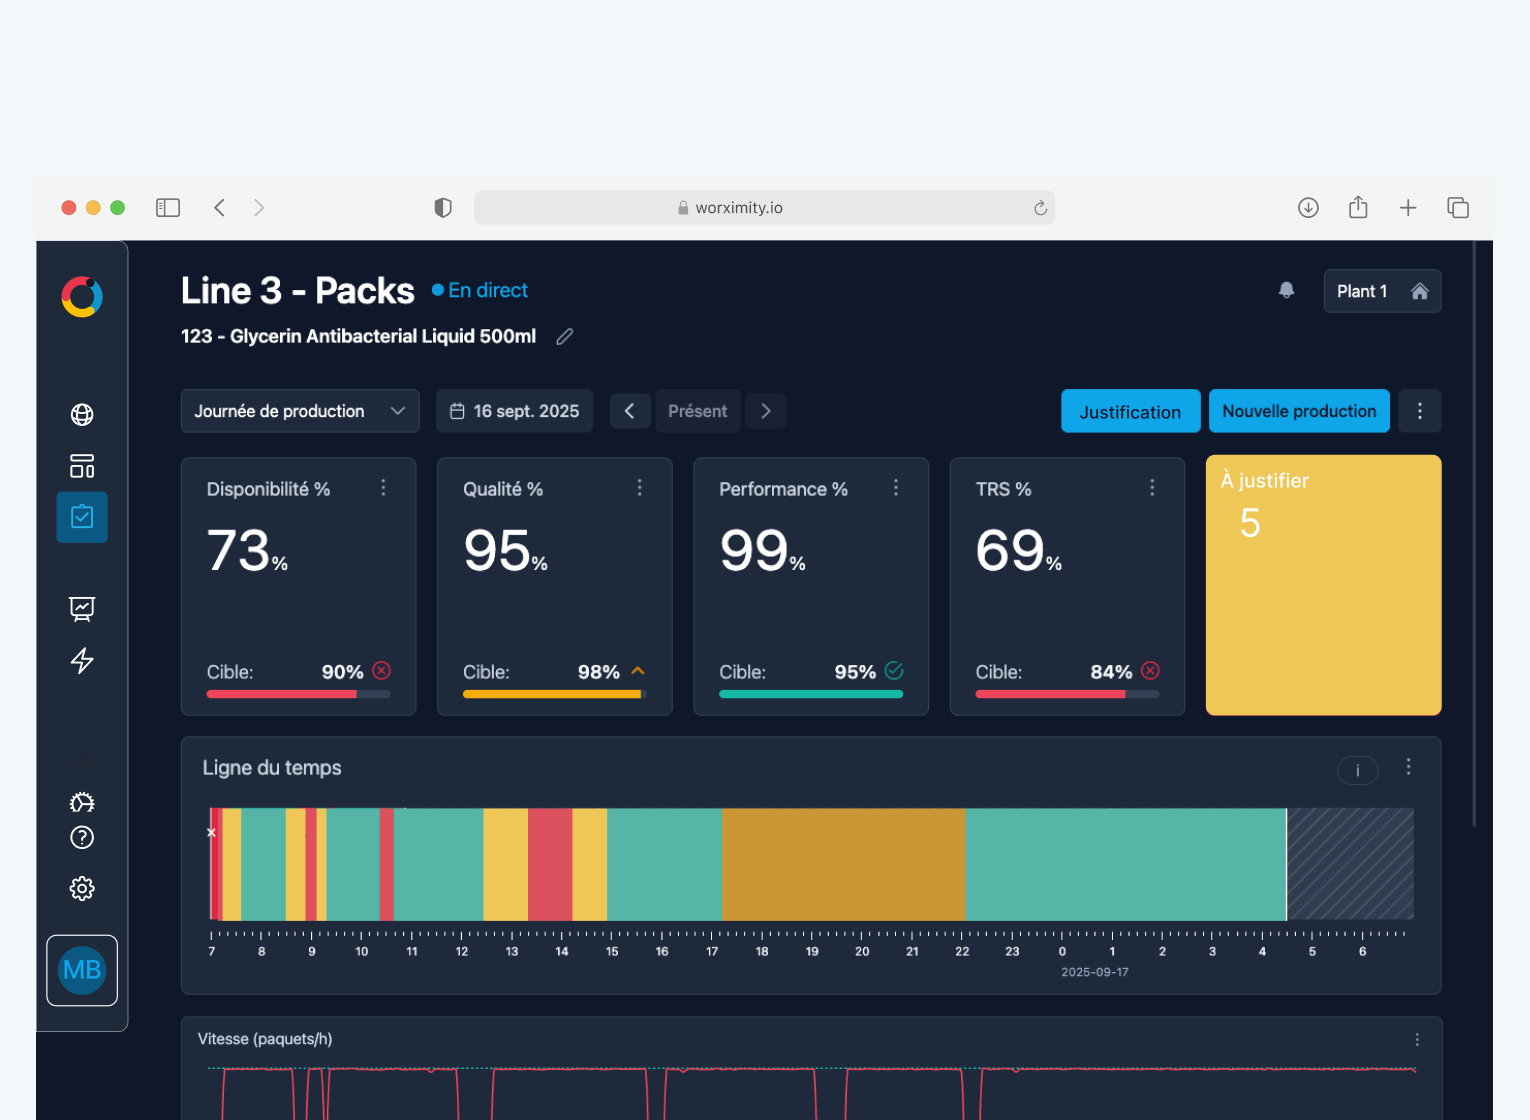
🐌 Performance Loss
Reveal what uptime hides. Spot slowdown causes with performance justifications and timeline cues.
Empower your team with the Speed Graph and Smart Target Rates—your secret weapon for accurate targets and fewer slowdowns.
Enable the performance loss timeline when your team is ready, without overwhelm.
Thank you for growing with us—we're building a better Worximity, step by step, with you in mind.
The old interface will be phased out over the coming months. Don't worry—we'll be here to support you and your team every step of the way.
