Performance Loss

What is Performance Loss?
Performance Loss helps you identify when production units, equipments, lines, or a particular product are running but performing below their target rates. Unlike downtime, it reveals the hidden slowdowns that impact OEE.
How it works
This feature is enabled upon request, as not all users share the same level of product maturity. Once activated, it applies to all Production Units in your factory (lines or equipment)
Calculation:
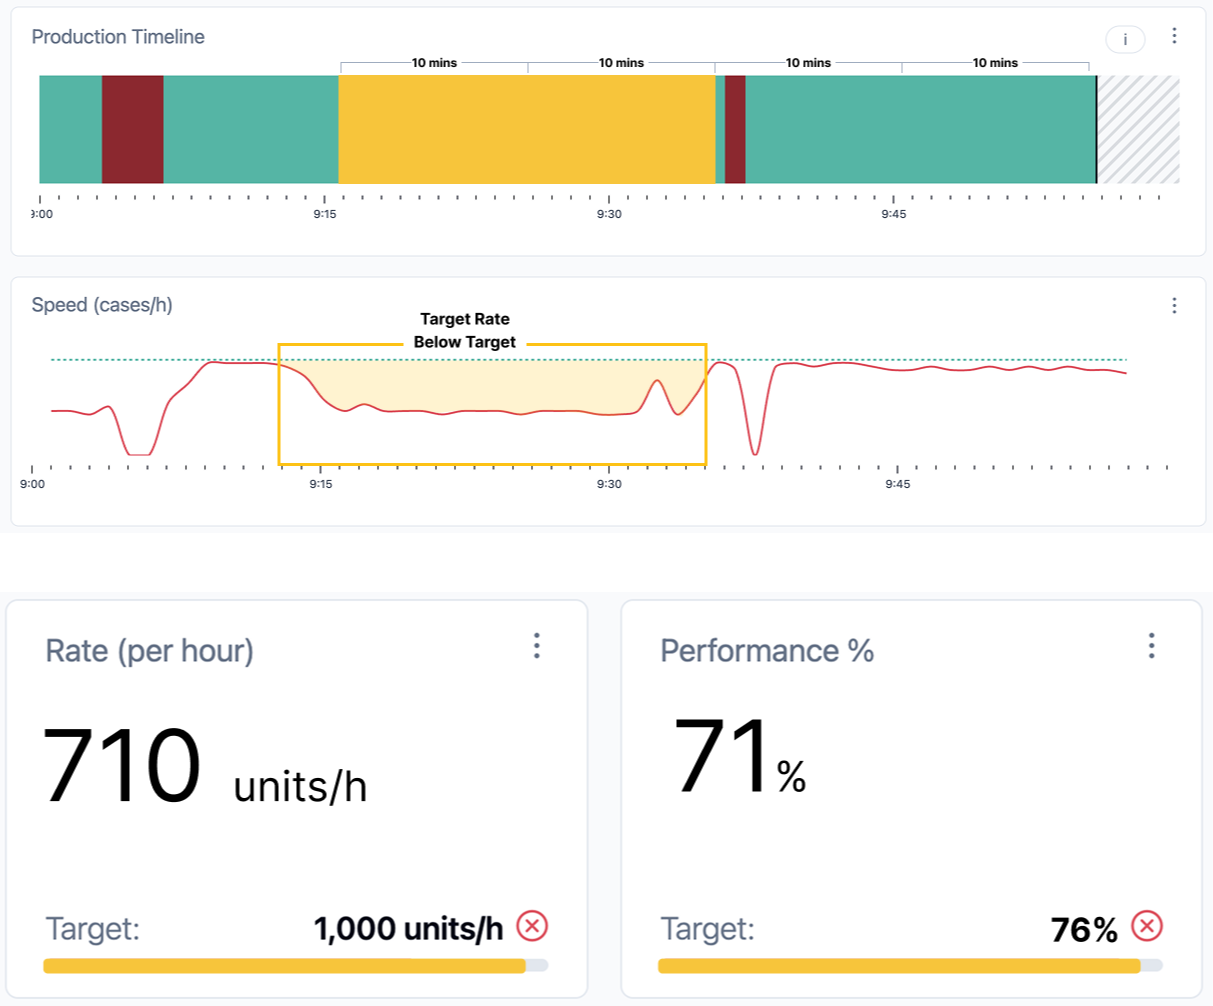
Worximity's environment detects Performance Loss Blocks (yellow segments in the timeline.) using three fixed parameters:
- A 10-minute consecutive uptime window is used to calculate a rolling average, helping to smooth out sudden production spikes.
- Losses shorter than 10 minutes are ignored.
- at 5% or less below the target performance for the Production Unit.
Example: If the target is 76%, any sustained performance at 71% or lower is flagged as a loss.
⚠️ Important: Since the algorithm looks for continuous UPTIME, Production Units with frequent micro-stops may not generate performance loss blocks.
You may notice a slight visual delay in the system metrics. Because of the 10-minute measurement window, the Speed Graph can show a ramp-up effect as the timeframe moves forward. This is normal—values will adjust automatically.
View Performance Losses
Once the feature is enabled.
1. On the Timeline
-
Open the 3-dots menu on the Timeline graph. and Select Performance Loss to display the yellow blocks that highlight periods of slowness.
2. Add the Performance Loss Tile
-
A yellow Performance Loss tile (similar to the downtime tile) shows the number of detected occurrences, and a live counter if a performance loss is ongoing.
-
Click the tile to open the Justification panel.
-
To add it, go to your dashboard’s 3-dots menu, choose Edit dashboard, and insert the tile (or replace an existing one).
3. Justify & Categorize Losses
-
Use the Performance Loss Justification panel to assign reasons to losses.
-
This helps track issues and identify opportunities for improvement.
⚠️ Note that the OEE and OOE calculation will NOT change with the selected justification. This is only meant to add context and help better detect periods below target.

This is the third milestone in building the Performance Loss module:
Smart Rates →Automatically set accurate production targets—ideal for new users who may not know the rates of all their products or new products where the correct target rate isn’t known from the start. Learn more
Speed Graph → Visualize when production speed falls below targets, even during uptime.
Performance Loss Justification → Detect, categorize, and justify performance-related losses.
Together, these tools transform how you track and act on hidden OEE losses, driving smarter Continuous Improvement.
This feature will be refined over the next few weeks, with additional improvements such as:
- Visibility of performance losses in the Production Unit Overview summary (accessible via the arrow button on the Overview tiles)
- Import and export of Performance categories and justification reasons
- Excel sheet to track justification entries
